Rancho Cucamonga is known for its warm and welcoming community and for having some of the best schools in the country. Neighbors would usually come together and enjoy outdoor concerts and other events throughout the year.
There are a plethora of activities for everyone of all ages. Programs and events, such as pool parties, dances, and tennis lessons are offered by the City of Rancho Cucamonga and are enjoyed by families. The Recreation and Events Department hosts year-round gatherings, including holiday celebrations and activities promoting art, entertainment, and culture. No wonder this city has been said to be one of the best places in the nation to raise a family.
If you are looking to invest in a residential property in Rancho Cucamonga, CA, here are a few things you might want to know before you start sending offers.
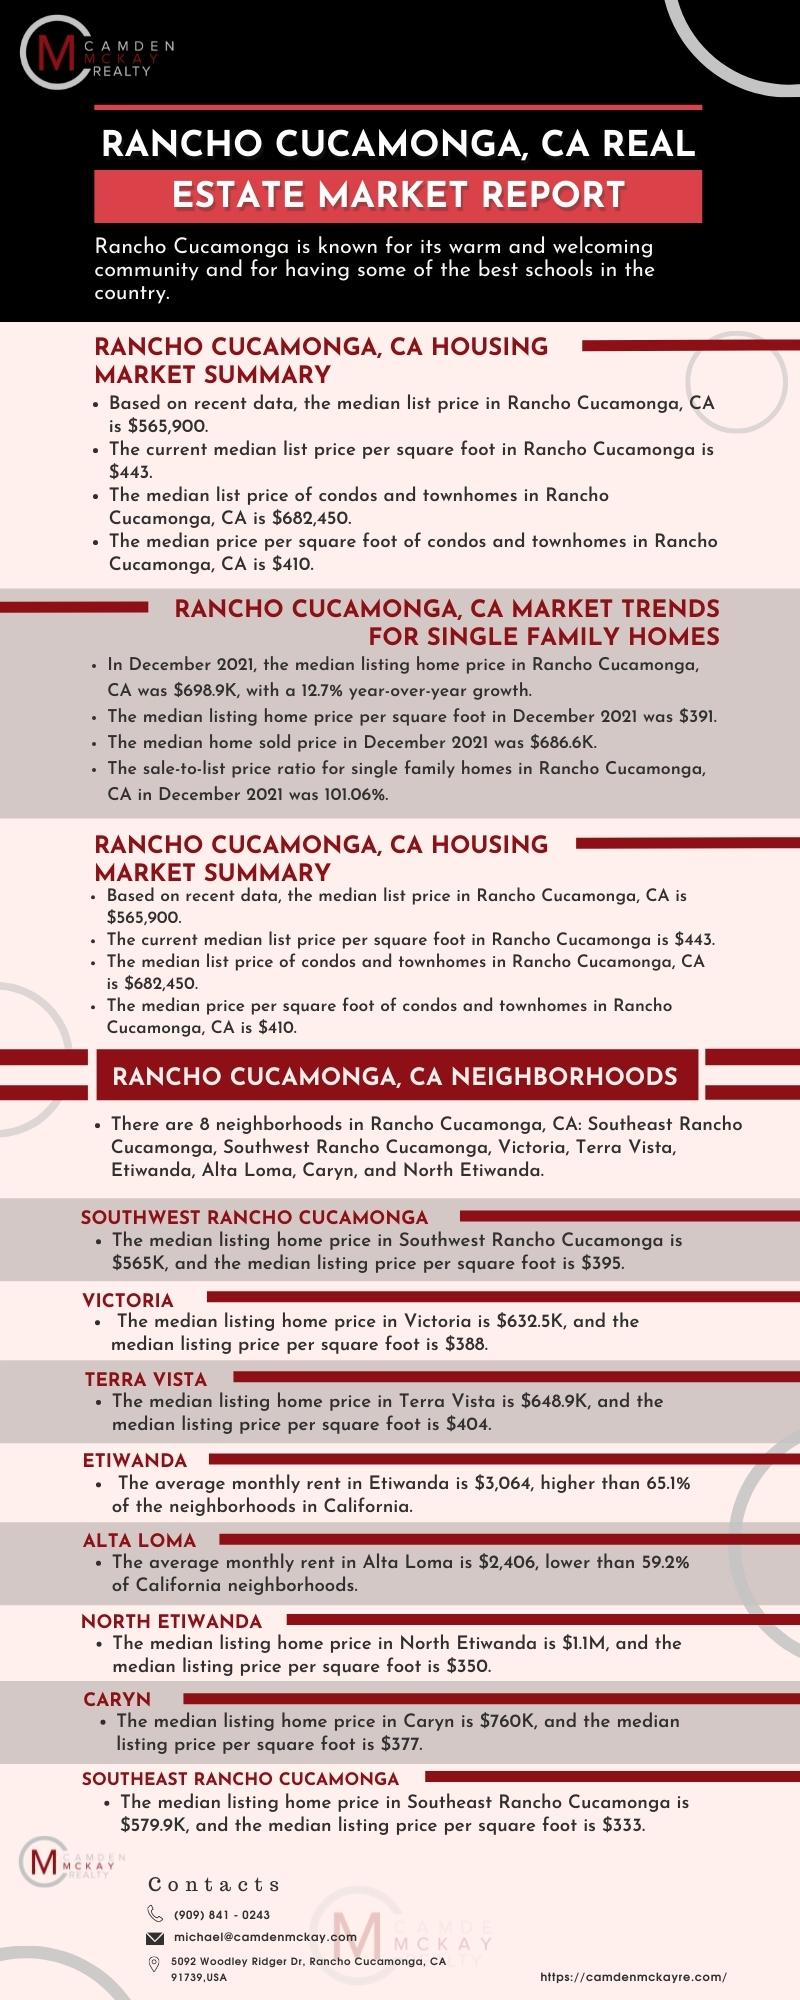
Rancho Cucamonga, CA Housing Market Summary
- Based on recent data, the median list price in Rancho Cucamonga, CA is $565,900.
- The median list price in Rancho Cucamonga decreased by 15% from December 2021 to January 2022.
- Rancho Cucamonga’s home resale inventories is 17, 5% lower compared to December 2021.
- The current median list price per square foot in Rancho Cucamonga is $443.
Rancho Cucamonga, CA Market Trends for Single Family Homes
- As of December 2021, Rancho Cucamonga, CA is a seller’s market.
- In a seller’s market, there are more people looking to buy than there are homes available.
- On average, homes in Rancho Cucamonga, CA sold for approximately the asking price in December 2021.
- In December 2021, the median listing home price in Rancho Cucamonga, CA was $698.9K, with a 12.7% year-over-year growth.
- The median listing home price per square foot in December 2021 was $391.
- The median home sold price in December 2021 was $686.6K.
- The sale-to-list price ratio for single family homes in Rancho Cucamonga, CA in December 2021 was 101.06%.
- The median days on market for single family homes in Rancho Cucamonga, CA last December 2021 was 55.
Rancho Cucamonga Market Trends for Condos and Townhomes
- The median list price of condos and townhomes in Rancho Cucamonga, CA last December 2021 was $682,450.
- The median price per square foot of condos and townhomes in Rancho Cucamonga, CA last December 2021 was $410.
- The median home size in Rancho Cucamonga, CA last December 2021 was 1,538 sqft.
- The median days on market for condos and townhomes in Rancho Cucamonga, CA last December 2021 was 77.
Rancho Cucamonga, CA Neighborhoods
- There are 8 neighborhoods in Rancho Cucamonga, CA: Southeast Rancho Cucamonga, Southwest Rancho Cucamonga, Victoria, Terra Vista, Etiwanda, Alta Loma, Caryn, and North Etiwanda.
Southwest Rancho Cucamonga
- Southwest Rancho Cucamonga has 23,468 residents and is the most walkable neighborhood in Rancho Cucamonga, CA.
- The median listing home price in Southwest Rancho Cucamonga is $565K, and the median listing price per square foot is $395.
Victoria
- On average, homes in Victoria sell for about 3% above the list price and go pending in around 24 days.
- The median listing home price in Victoria is $632.5K, and the median listing price per square foot is $388.

Terra Vista
- Terra Vista, with 18,485 residents, is the second most walkable neighborhood in Rancho Cucamonga.
- The median listing home price in Terra Vista is $648.9K, and the median listing price per square foot is $404.
Etiwanda
- Etiwanda’s median home sale price is $653,754, more expensive than 48.0% of the neighborhoods in California and 86.7% of the neighborhoods in the nation.
- The average monthly rent in Etiwanda is $3,064, higher than 65.1% of the neighborhoods in California.
Alta Loma
- The median home sale price in Alta Loma is $318,737, less expensive than 84.8% of California neighborhoods and 51.5% of the neighborhoods in the country.
- The average monthly rent in Alta Loma is $2,406, lower than 59.2% of California neighborhoods.
North Etiwanda
- The median household income for residents of North Etiwanda, Rancho Cucamonga, which has a population of 10,676, is $147,797, while the median individual income is $61,296.
- The median listing home price in North Etiwanda is $1.1M, and the median listing price per square foot is $350.
Caryn
- The median household income for residents of Caryn, Rancho Cucamonga, with a population of 846, is $133,377, while the median individual income is $52,731.
- The median listing home price in Caryn is $760K, and the median listing price per square foot is $377.
Southeast Rancho Cucamonga
- Southeast Rancho Cucamonga has 4,448 residents.
- The median listing home price in Southeast Rancho Cucamonga is $579.9K, and the median listing price per square foot is $333.

Renting an Apartment in Rancho Cucamonga, CA
- The average monthly rent of a studio apartment in Rancho Cucamonga is $2,103.
- The average monthly rent of a one-bedroom apartment in Rancho Cucamonga is $2,282.
- The average monthly rent of a two-bedroom apartment in Rancho Cucamonga is $2,917.
Life in Rancho Cucamonga, CA
- Rancho Cucamonga, CA is a mid-size city with less than 175,000 residents.
- The average age of the city’s population is just over 36, which is younger compared to most cities in California.
- Most Rancho Cucamonga residents own their homes, while 39% of residents rent.
- Rancho Cucamonga has an average commute time of 35 minutes, a little longer than the state average of 32 minutes.
- Public transportation is not widely used 43% of residents commuting to work prefer to drive.
- The three primary industries in Rancho Cucamonga are retail, healthcare, and education, making up 20% of the city’s workforce.
- Many of the residents in Rancho Cucamonga work in sales, which ranks as the top career path in the city.
- The average annual income of workers in Rancho Cucamonga is over $95K, around $10,000 more compared to their peers elsewhere in California and significantly higher than the national average of $73,345.
If you are considering investing in a residential real estate property in Rancho Cucamonga, CA, feel free to get in touch with us and we will be more than happy to help you find the perfect house. Give us a call today at (909) 841-0243 or send us an email at michael@camdenmckay.com if you have any questions or if you would like to schedule an appointment.